GRAKN DATA BASE
GRAKN.AI is an open-source, distributed knowledge graph for knowledge-oriented systems. It is an evolution of the relational database for highly interconnected data as it provides a concept-level schema that fully implements the Entity-Relationship (ER) model. Grakn provides the knowledge foundation for cognitive and intelligent (e.g. AI) systems, by providing an intelligent language for modelling, transactions and analytics. Being a distributed database, Grakn is designed to scale over a network of computers through partitioning and replication
Let me explain more on this Grakn DB. I have Country, language and City tables where it has below columns for City.

Let me explain more on this Grakn DB. I have Country, language and City tables where it has below columns for City.
| | Column | Type | Null | Key | Default | Extra | | |
| +-------------+----------+------+-----+---------+----------------+ | |
| | ID | int(11) | NO | PRI | NULL | auto_increment | | |
| | Name | char(35) | NO | | | | | |
| | CountryCode | char(3) | NO | MUL | | | | |
| | District | char(20) | NO | | | | | |
| | Population | int(11) | NO | | 0 | | | |
| +-------------+----------+------+-----+---------+----------------+ |
As you can see, there are 5 columns in the table (confusingly shown as rows in the output): ID, Name, CountryCode, District and Population. The ID is the Primary Key for the table, which uniquely identifies each record. This will be important later, when we migrate to Grakn.
The following statement gives us a peek at the first 10 items of city data
SELECT * from City LIMIT 10;
| | ID | Name | CountryCode | District | Population | | |
| +----+----------------+-------------+---------------+------------+ | |
| | 1 | Kabul | AFG | Kabol | 1780000 | | |
| | 2 | Qandahar | AFG | Qandahar | 237500 | | |
| | 3 | Herat | AFG | Herat | 186800 | | |
| | 4 | Mazar-e-Sharif | AFG | Balkh | 127800 | | |
| | 5 | Amsterdam | NLD | Noord-Holland | 731200 | | |
| | 6 | Rotterdam | NLD | Zuid-Holland | 593321 | | |
| | 7 | Haag | NLD | Zuid-Holland | 440900 | | |
| | 8 | Utrecht | NLD | Utrecht | 234323 | | |
| | 9 | Eindhoven | NLD | Noord-Brabant | 201843 | | |
| | 10 | Tilburg | NLD | Noord-Brabant | 193238 | | |
| +----+----------------+-------------+---------------+------------+ |
Lets get some more information like where city belongs to Sydney ,AUS
SELECT * FROM City WHERE Name = 'Sydney';
| | ID | Name | CountryCode | District | Population | | |
| +-----+--------+-------------+-----------------+------------+ | |
| | 130 | Sydney | AUS | New South Wales | 3276207 | | |
| +-----+--------+-------------+-----------------+------------+ |
You can experiment in a similar way with the country and country-language
tables as well. so, we have to write multiple queries to fetch the data and after we have to analyse
the relationships. But Grakn is different and it is revolution of RDBMS
we can get everything on graph and can easily know the relationship and roles along with entity
attribute values. also, we can easily navigate through.
If we get the same requirement using GRAKN then the results will be looks like below
Querying the Graph
We can now make queries on the graph as follows. Let’s reproduce some of the queries we made previously in SQL.SQL SELECT * from city LIMIT 10; Graql match $x isa city; offset 0; limit 10;If successful: you should see a list of 10 countries following the query.Similarly, query for information about the city of Sydney:SQL SELECT * FROM city WHERE Name = ‘Sydney’; Graql match $x isa city, has name "Sydney";Problems?
The Grakn team is super helpful in sorting out when things went wrong and, if you have any problems, please get in touch for help too. Just make contact via our Community page, or leave a comment below or on our Slack Channel.Visualising the Data
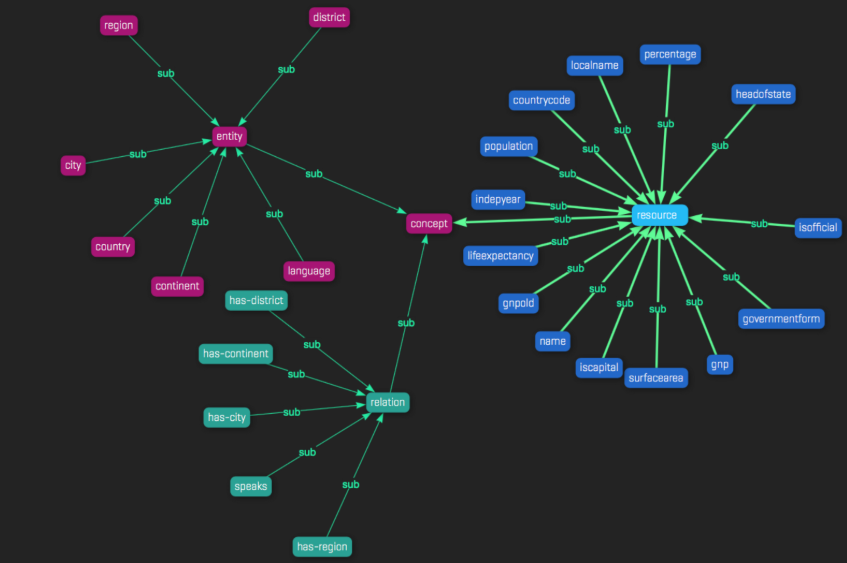
The Grakn visualiser is a cool way to look at the resulting graph and explore the data. With the Grakn engine running and the graph loaded, in your browser, navigate
to http://localhost:4567/ which will allow you to make queries on the graph. It’s a nice way of seeing how data is connected, which fits much better — in my view — with how I think about cities and countries, than a table with rows and columns. Let’s explore …We can show 10 countries and their cities:
match $x isa has-city; offset 0; limit 10;In grakn Visualiser

WHY MOVED TO GRAKN DB?
You may be wondering why I’ve bothered moving the data from a relational database into a Grakn graph. After all, isn’t it fine as it is? Well yes, and no. Although relational databases have benefits that include simplicity and familiarity, they also have limitations. If you are just doing basic read/writes on straightforward data, SQL may well be adequate for your needs. But, remember that I chose a simple, familiar example specifically to make this article easy to follow. If you have a more complex domain with highly interconnected data, which is very probable in today’s information landscape, you will quickly see significant benefits, since describing the relationships within data is the primary characteristic of a graph database. In this aspect, a relational database cannot begin to provide the equivalent speed or flexibility as a graph.
As a knowledge base, GRAKN.AI has an additional benefit over standard graph databases, since it allows complex data modeling, verification, scaling, querying and analysis. A key step is the definition of an ontology, which facilitates the modeling of complex datasets and guarantees information consistency. Inference rules allow the extraction of implicit information from explicit data, to achieve logical reasoning over the represented knowledge.


Comments
Post a Comment